
Google Search Console (GSC) and its new Generative AI report give site owners a first-party view of pages that appear in AI Overviews and AI Mode, but its early, impressions-only dataset cannot show the prompts, clicks, or revenue behind that visibility. Fast Frigate Digital Marketing is treating the report as an extra diagnostic layer for U.S. SEO and GEO work: a way to study where Google is surfacing a site, compare those pages with conventional Search performance, and start making smarter page-level decisions.
Early access was inconsistent. Some practitioners could not find the report, while others saw page-level inclusion data without clicks, queries, or outcome metrics. On August 11, Search Engine Roundtable reported apparent availability across the 25 profiles Barry Schwartz checked, and Search Engine Watch reported signs of a broader launch. Google has not formally announced that every U.S. property has access, and its Help documentation still describes the rollout as phased.
What Lies Beneath…
- New Tab, Immediate Letdown
- What Google Actually Shipped
- Why First Impressions Of The Report Differ
- Use It As A Diagnostic Layer, Not A Scorecard
- How To Build Your First Baseline Snapshot
- Where The Data Stops
- Frequently Asked Questions
- What To Do Now, And What To Watch Next
New Tab, Immediate Letdown
Google announced the reports on June 3, 2026, as dedicated views of a site’s impressions in AI Overviews, AI Mode, and Discover. The initial release covered a subset of websites while Google tested the reports and collected feedback.
By August 11, Schwartz’s reporting suggested that access had broadened beyond the original test group, while Search Engine Watch noted a new in-product prompt directing users to the report. A larger group of U.S. site owners can now review the same data, but the report still does not provide the business answer many of them want.
The report supports visibility diagnosis. It does not attribute traffic or leads, and it does not establish that a page ranked for a particular AI prompt. Its value depends on using it for questions the available data can answer.
In its June announcement, Google said it was still working with website owners to understand which insights and data would be most helpful:
“We’re continuing to work with website owners to understand what insights and data would be most helpful to inform their strategies, such as adding additional metrics over time.” Google Search Central
Google has positioned the report as an early version and invited feedback on the data it should add. Use the available metrics for the questions they can answer, and document the questions they cannot.

What Google Actually Shipped
GSC provides two reports: one for Google Search, covering AI Overviews and AI Mode, and another for Discover. The Search report groups impression data by Pages, Countries, Devices, and Dates. Google’s launch announcement outlines the feature, while the Help documentation explains important reporting details. A Pages row generally reflects the final URL after redirects and is usually assigned to the canonical URL Google selected. This affects parameterized URLs, language variants, and redirects; a CMS URL does not necessarily determine the reporting URL.
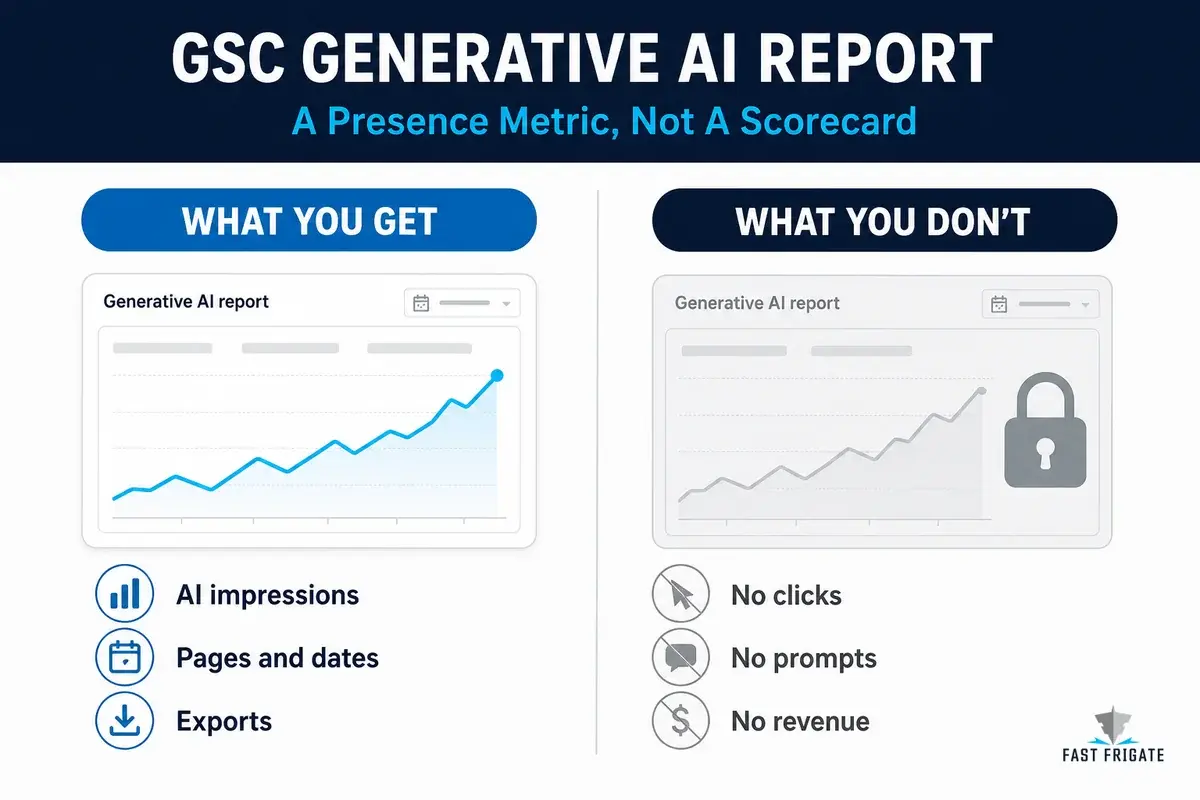
The chart and Pages table use different aggregation methods. The chart reports property-level impressions, while the Pages table reports page-level impressions. If two URLs from the same site appear in one generative response, the chart can count one property impression while the table assigns an impression to each URL. The page-row total may not match the chart total.
| The Report Gives You | The Report Does Not Give You |
|---|---|
| Impressions from AI Overviews and AI Mode | Dedicated clicks or CTR for those impressions |
| Page-level, country, device, and date views | The prompt or query that caused a page to appear |
| A way to isolate generative visibility that otherwise remains blended into Web performance data | A separate AI Overview versus AI Mode breakout |
| Chart and table exports | Citation placement, passage selection, conversion, or revenue data |
Several details can affect reporting. Search Labs experiments are excluded. Discover is reported separately and should not be folded into a casual “total AI” figure. The most recent data can be preliminary, and the standard Search Performance constraints still apply, including the 1,000-row limit. Exports convert ~ and - values to zero, so preserve a flag that distinguishes unavailable values from zero.
Google’s guidance for generative Search says its generative experiences retrieve content from the existing Search index through retrieval-augmented generation and query fan-out, and that foundational SEO still applies. Google does not endorse special AI markup, llms.txt files, compulsory “chunking,” or rewriting a site for every imagined conversational variation. The new report makes one slice of existing visibility easier to inspect. Our schema guide explains where structured data fits without suggesting that it guarantees citation.
Why First Impressions Of The Report Differ
Early reactions center on a straightforward trade-off. Google now shows which pages from a verified property appeared in its generative Search features. That is a new first-party inclusion signal. It does not explain the queries, clicks, citation placement, or commercial effect behind it.
Carolyn Shelby describes the report as a “diagnostic lens, not a new scoreboard:”
“The real value of the report is not the total impression count. It is the ability to compare which pages Google uses in generative search with how those pages perform elsewhere.” Search Engine Journal
A practical workflow follows from that framing: compare pages that appear in generative Search with pages that perform in ordinary Web results. Group the results by content type, template, topic, purpose, author, or revision history. A repeated pattern is worth investigating.
Aleyda Solís separates AI-search measurement into presence, readiness, and business impact. The Generative AI report addresses presence only: it records that Google showed a page in a generative result. It cannot identify the query, explain the selection, show the click, or connect the inclusion to a lead, transaction, or other commercial outcome. Readiness and business impact require evidence from outside this report.
AI Mode follow-up queries can appear in the regular Search Performance report because Google documentation treats a follow-up as a new query. That can produce conversational-looking queries in the ordinary query report, but it does not create a reliable connection between a query and an individual Generative AI report page row.
An early Google Analytics subreddit thread showed that people who found the report were seeing a different set of pages near the top. The useful next step is to identify why those pages appear and what they have in common.
Use It As A Diagnostic Layer, Not A Scorecard
For Fast Frigate client work, use the report alongside standard GSC data and analytics. It adds a Google-only input to our broader AI visibility framework, but it does not provide multi-platform citation tracking, referral attribution, or commercial reporting.
Start at the URL level. Export the Pages table from the Generative AI report, then export the Pages table from standard Search Performance using the same dates, country, device, and property scope. Use the Web search type as the comparison base. Add a landing-page export from GA4 for the same window, along with any lead, transaction, or engagement outcome you can reasonably associate with the page. Preserve raw exports because the report has limited history and Google may change the product.
The workable data set needs four pieces, each with a clearly limited role.
| Dataset | Required Fields | What It Can Tell You | What It Cannot Prove |
|---|---|---|---|
| Generative AI Pages export | Canonical URL, AI impressions, selected dates and filters | Which pages Google showed in AI Overviews or AI Mode | The query, click, placement, or outcome behind the inclusion |
| Standard Search Performance Pages export | Canonical URL, impressions, clicks, CTR, position | Conventional Search context for the same page and period | A non-AI baseline, because AI data remains included in the Web report |
| Analytics landing-page export | Page, sessions, engaged sessions, leads, revenue where available | Whether a page’s broader site outcomes moved during the same period | That an AI impression created the session or conversion |
| Change log | URL, date, material change, owner, hypothesis | What changed before a sustained trend shifted | Causation from one edit and one short rise |
Use descriptive measures to make the page list easier to interpret. A generative impression share is Generative AI report impressions divided by standard Web impressions for the same scope. It is a visibility-mix indicator, not a click share. A concentration ratio is the share of generative impressions held by the top 10 AI-visible URLs. It shows whether a small set of pages carries most of the site’s AI presence. An outcome overlay compares that page’s AI-impression trend with sessions, leads, or revenue without claiming a direct causal relationship.
A high-generative, low-organic page may indicate that Google finds a particular explanation, comparison, or data point useful in answers. A high-organic, low-generative page may warrant a review of answer clarity or extractable HTML, though it may simply target a query that does not trigger a generative feature. Use these differences to form and test hypotheses, not to label every page as a GEO success or failure.
How To Build Your First Baseline Snapshot
Create a straightforward monthly routine. Start with one raw baseline export for each eligible property. Record the date range, filters, time zone, and whether the data point was preliminary. Normalize URLs only after keeping an untouched copy. Tag page type, directory, template, funnel stage, and recent material revisions.
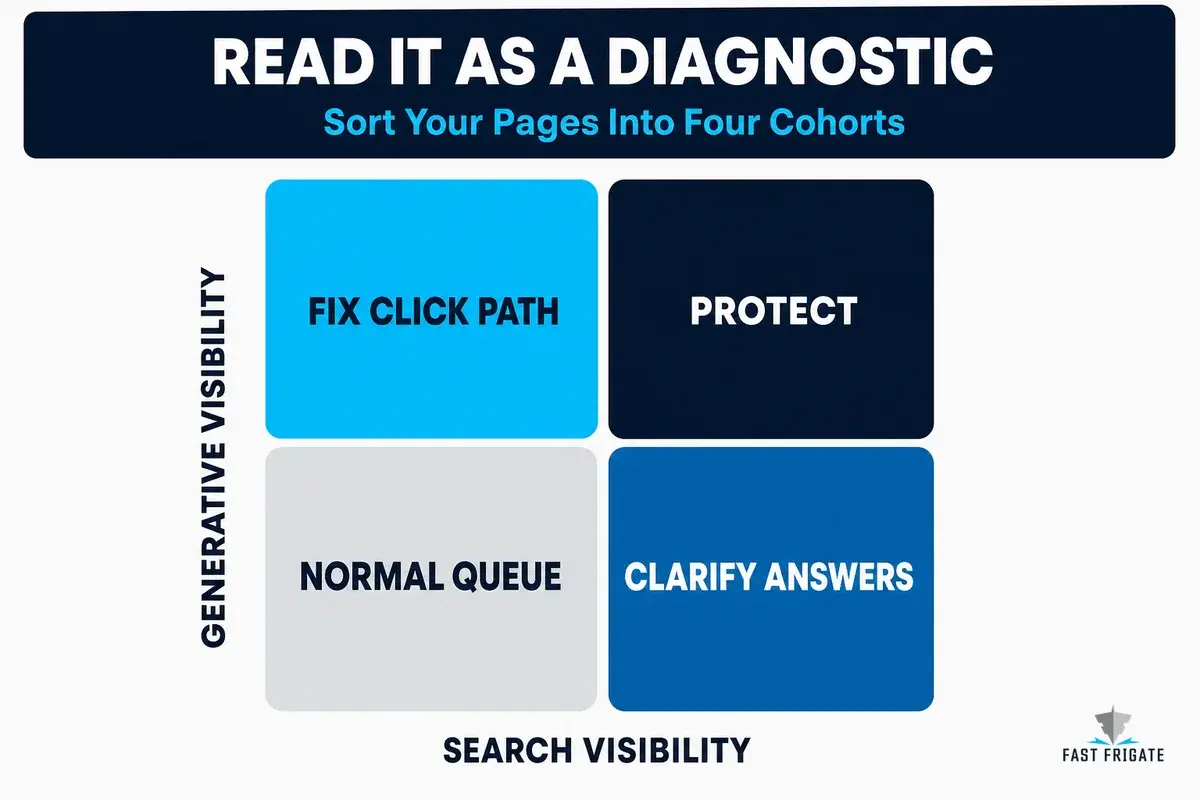
Classify URLs into four rough cohorts to make the next review shorter.
| URL Cohort | What It May Signal | First Response |
|---|---|---|
| High conventional visibility / high generative visibility | A content or template pattern worth protecting and studying | Identify recurring evidence, structure, format, and intent before trying to replicate it |
| High conventional visibility / low generative visibility | A possible answer clarity, formatting, or intent mismatch | Check whether the query class even produces generative answers before changing the page |
| Low conventional visibility / high generative visibility | A potentially useful source page with weak click paths or limited ordinary demand | Protect the asset, examine internal links, and inspect whether the page supports a commercial journey |
| Low conventional visibility / low generative visibility | Normal SEO prioritization territory | Use the usual opportunity model rather than treating the absence as an AI-only defect |
Do not rewrite every high-organic, low-generative page at once. Select a small set, make a material improvement, record the date, and allow enough time to assess whether the change holds. Clear answer-first copy, updated original evidence, a better comparison table, content moved out of a script or image, and stronger internal links are defensible changes whether the Generative AI report moves or not. Our AI citation guide covers the broader content and extractability work behind that review.
Maintain an unchanged comparison group long enough to distinguish the impact of an edit from demand, seasonality, changing AI-feature prevalence, or Google updates.
Where The Data Stops
The core unanswered question is commercial: did generative Search produce a qualified visit, a lead, a transaction, a call, or even a brand preference? The new report cannot answer that. It has no dedicated click number. It has no CTR. It has no query list. It cannot identify whether an impression came from AI Overview or AI Mode, how prominently a source was shown, or which passage Google used. It cannot show an agency the exact prompt a buyer asked or tell a client that a content change generated a sale. Those are not small omissions. They define the boundary of the report.
Large sites and international teams face additional limitations. The row limit can truncate the long tail. Canonical handling can assign data to a Google-selected version rather than the URL someone expected. A country comparison can reflect feature availability as much as content quality, a page-table total can exceed a property-chart total, and the newest dates can change. At publication, no documented standalone API or native BigQuery export supports the dedicated report. Use a scheduled CSV snapshot to preserve history; missing fields cannot be recovered through automation.
Google continues to work with site owners on additional metrics. It may add clicks, queries, surface detail, or a supported export path. The timing and scope remain unknown. A saved monthly record of visible pages, filters, and relevant business outcomes will become more useful if the report expands later. Starting after the product becomes richer means losing a clear before-and-after window.
Do not blend this report with ChatGPT, Perplexity, Claude, Copilot, or standalone Gemini reporting and call the sum “AI performance.” Those products have different interfaces, retrieval systems, citation behavior, user intent, and measurement blind spots. The GSC report covers generative features inside Google Search, not the broader AI-search landscape.
Frequently Asked Questions
What Does The GSC Generative AI Report Show?
The Search report shows how often URLs from a verified property appeared in Google Search’s supported generative features, currently AI Overviews and AI Mode. You can group the impressions by page, country, device, and date. It is a dedicated view of data that remains part of the broader Web performance reporting, not a separate traffic source.
Does The Generative AI Report Show Clicks From AI Overviews Or AI Mode?
No. Google’s dedicated report currently reports impressions only. It does not include clicks, CTR, average position, dedicated conversion data, citation placement, or a passage-level explanation of how a URL was used.
Why Do The Chart And Pages Table Totals Not Match?
The chart is aggregated at the property level while the Pages table is aggregated by page. If two URLs from the same property appear in one generative response, the chart can count one property impression while the table assigns an impression to each page. Compare like with like before treating a difference as a reporting error.
Can I See The Queries That Triggered AI Overview Or AI Mode Impressions?
Not in the dedicated Generative AI report. AI Mode follow-up queries can appear in the regular Search Performance report because Google treats them as new queries, but that does not create a reliable connection between a query and an individual Generative AI report page row.
How Should An Agency Report Generative AI Impressions To Clients?
Call them a visibility or inclusion signal and report them alongside, not inside, conventional Search and analytics results. Show the pages involved, the concentration of visibility, meaningful material changes, and the trend over a reasonable period. Do not label the number as AI traffic, ROI, leads, or revenue without another source that can substantiate that claim.
What Should I Do If The Generative AI Report Is Missing Or Empty?
Google’s documentation says the report may be unavailable because access is still rolling out, the property has not received enough generative-AI impressions, or the site has been excluded from Search generative AI features. Check the property’s inclusion settings before diagnosing a content problem, then keep an eye on the report rather than assuming an empty view is a verdict on the site.
What To Do Now, And What To Watch Next
Broad access does not create a mature AI-search measurement discipline. Begin by exporting the data, preserving the raw record, studying the pages that repeatedly appear, and comparing them with ordinary Search performance and business outcomes without treating those measures as equivalent.
Do not treat generative impressions as a headline KPI before the report can support that use. Establish a clean baseline while the tool is young, use it to investigate the pages Google surfaces, and wait for the missing measurement pieces before drawing outcome conclusions.
 How to Optimize VDPs (Vehicle Detail Pages) For AI Visibility